See which risks reach which business services, with the evidence to act.
Infracast discovers assets read-only across cloud and on-premises, links them with findings and attack paths in one graph, and generates assessment evidence from that same data.
Government
Agency authorization package support and contractor assessment preparation, with an air-gapped option. Drafts are generated from collected data and reviewed by people.
Government solutions → For security and compliance teamsCommercial
Show which business services an exposure reaches, route the fix to an owner, and keep the evidence for HIPAA, PCI DSS and SOC 2 work.
Commercial solutions →One workflow, five steps
Each step starts from what the previous one found. Every screen below is a real screenshot of the demo tenant, which holds sample data.
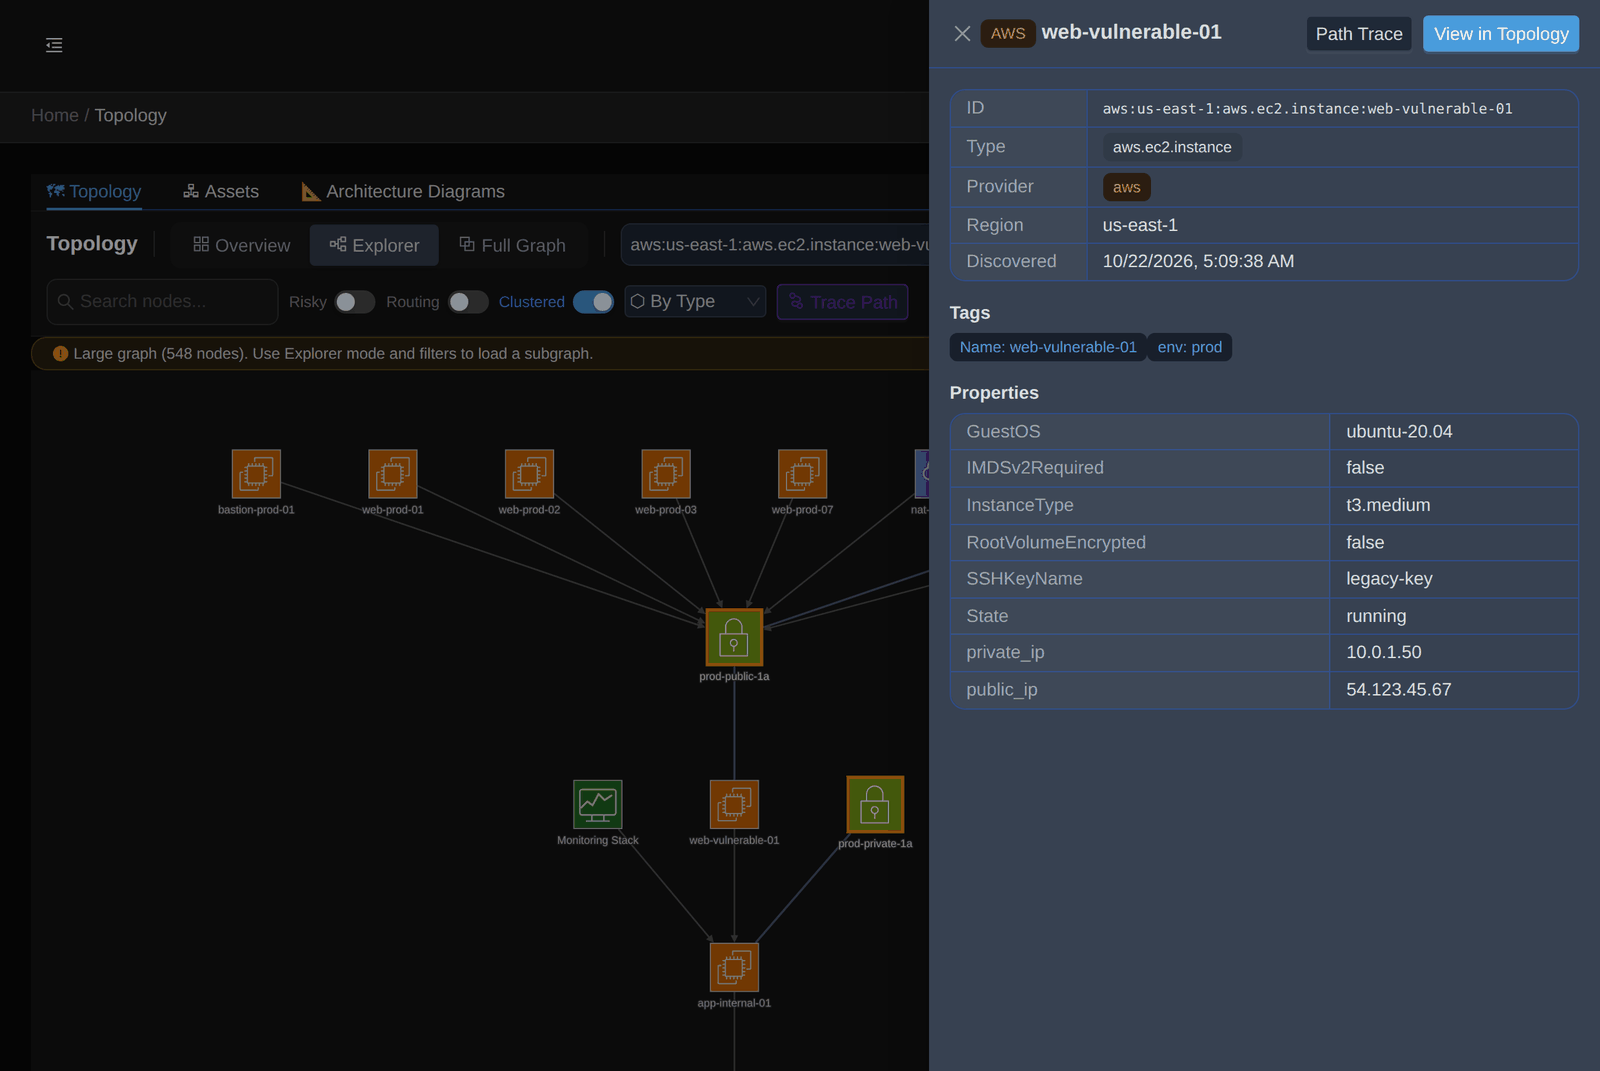
Discover the asset
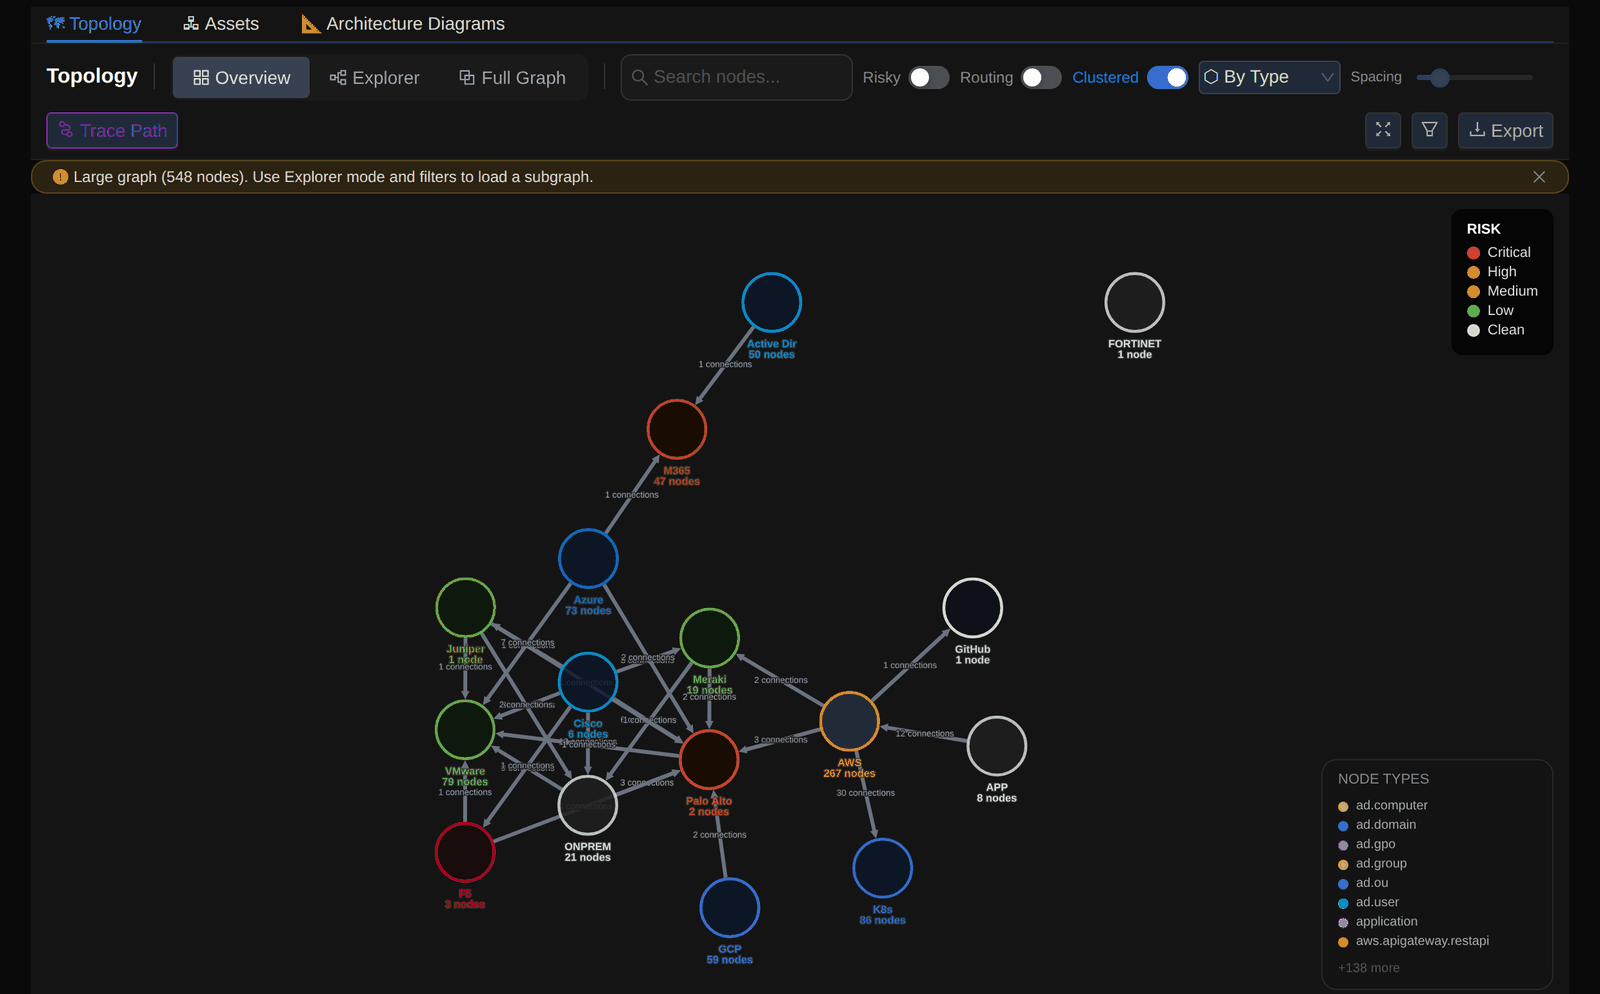
Read-only connectors build the topology: cloud accounts, network devices, servers and more, grouped by type with risk shown on each cluster.
Assets and their relationships in one topology view.
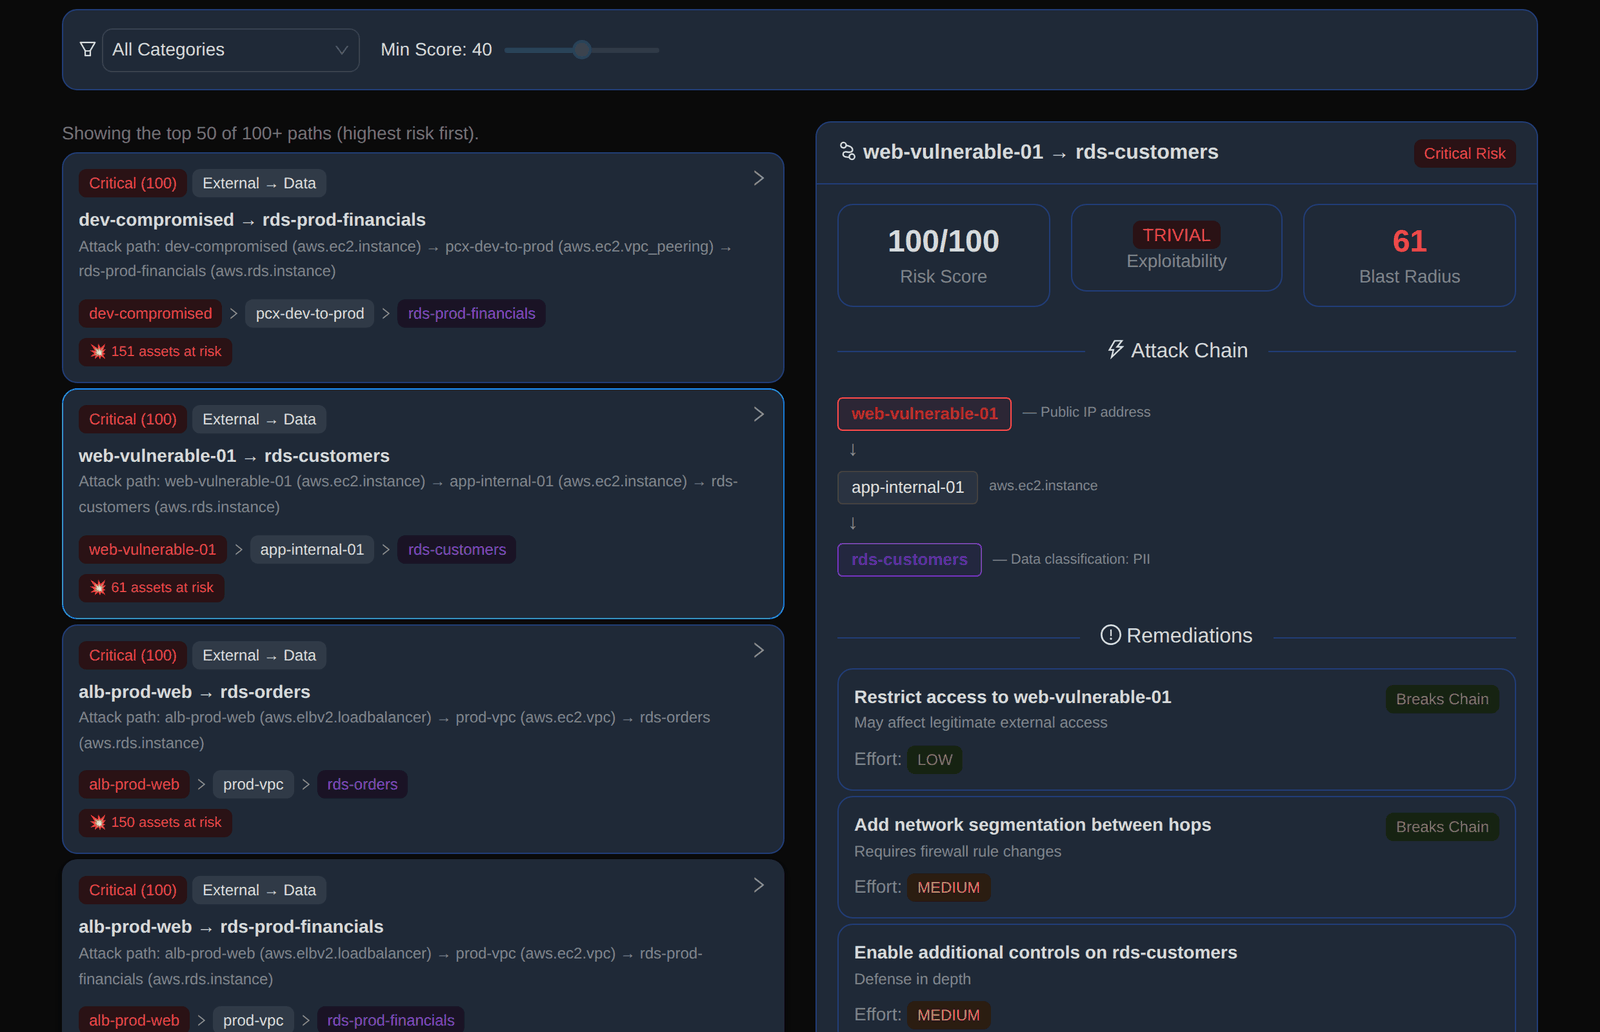
Investigate the attack path
Follow how an internet-facing asset reaches sensitive data, using attack paths that account for network egress, gateways and security groups.
A ranked list of paths with risk score, exploitability, blast radius and the attack chain to a data store.
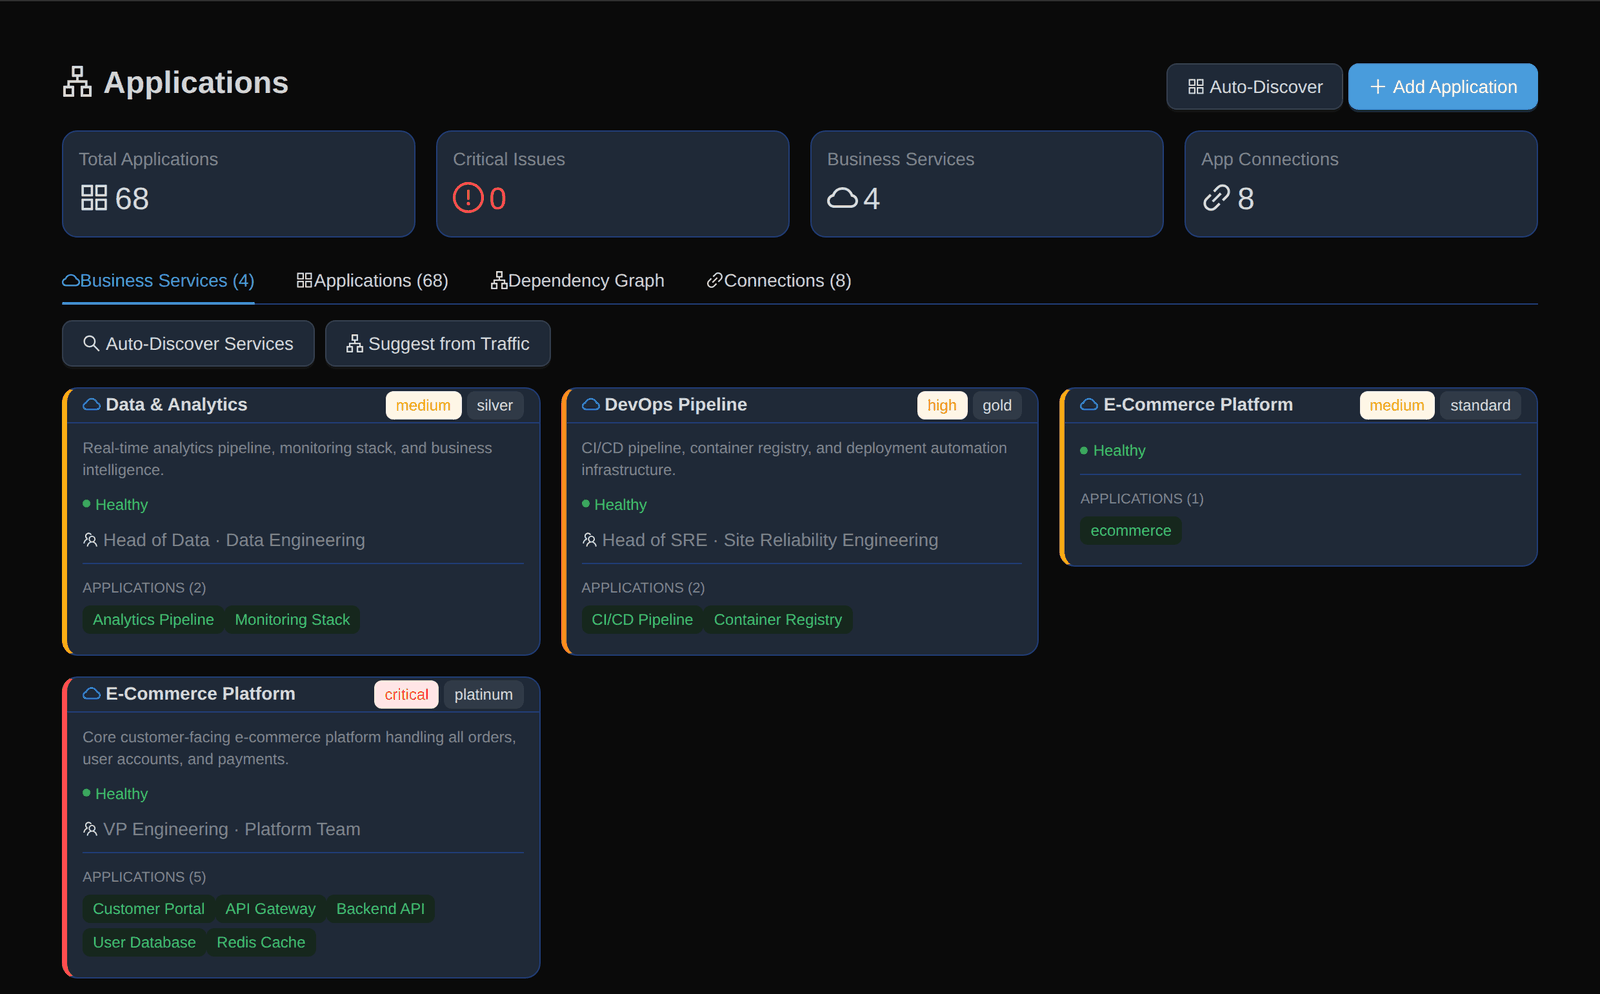
Identify the affected business service
Infracast groups applications into Business Services. Each service carries a criticality, an SLA tier, an owner and team, and the applications it contains, so the impact and the person to call are clear.
Business Services with criticality, SLA tier, owner and member applications.
Assign remediation
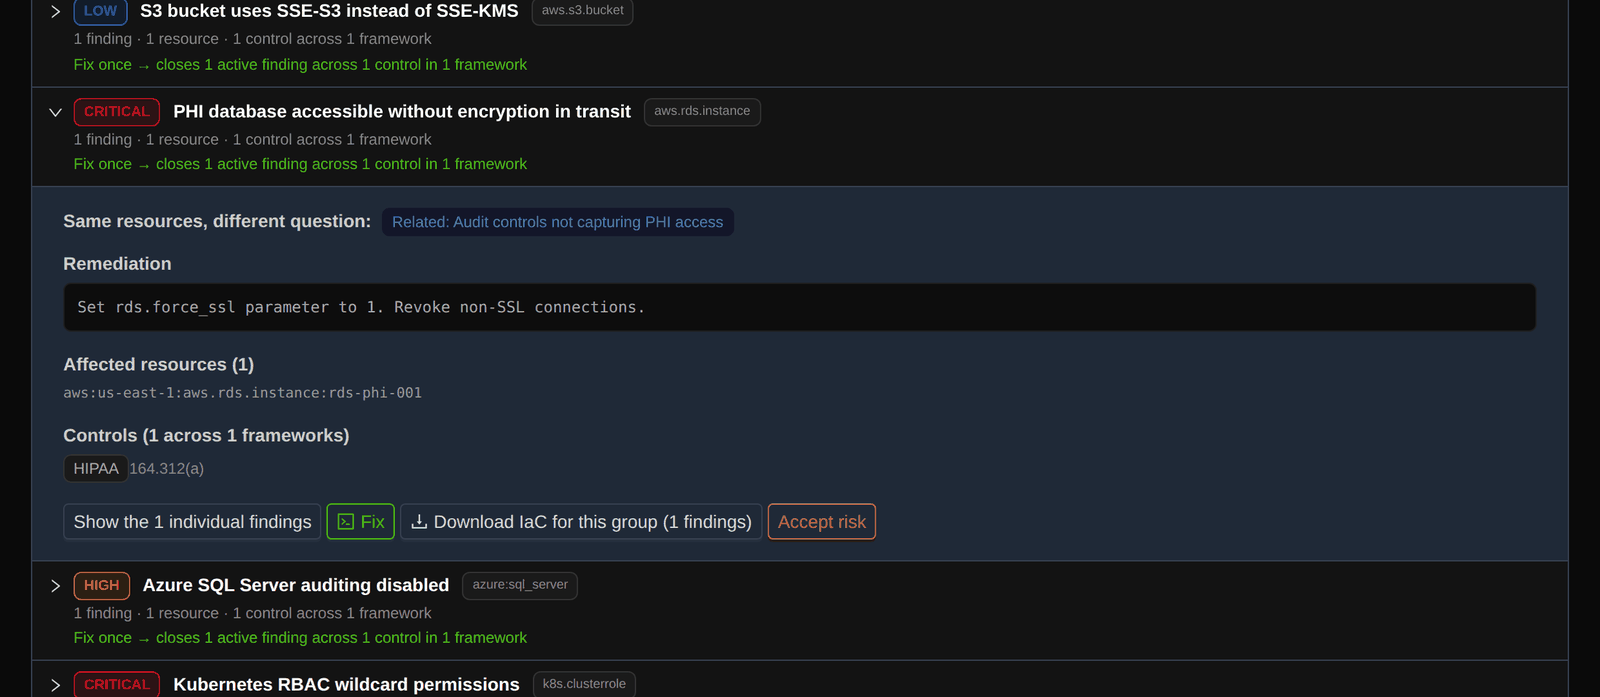
Each finding carries its remediation, the affected resource and the framework control it maps to. Track the fix as a POA&M item (Plan of Action and Milestones) with severity, mapped controls, status, point of contact and scheduled completion, instead of mailing it around.
The remediation step, the affected resource and the mapped control for a critical finding.
Generate the supporting documents
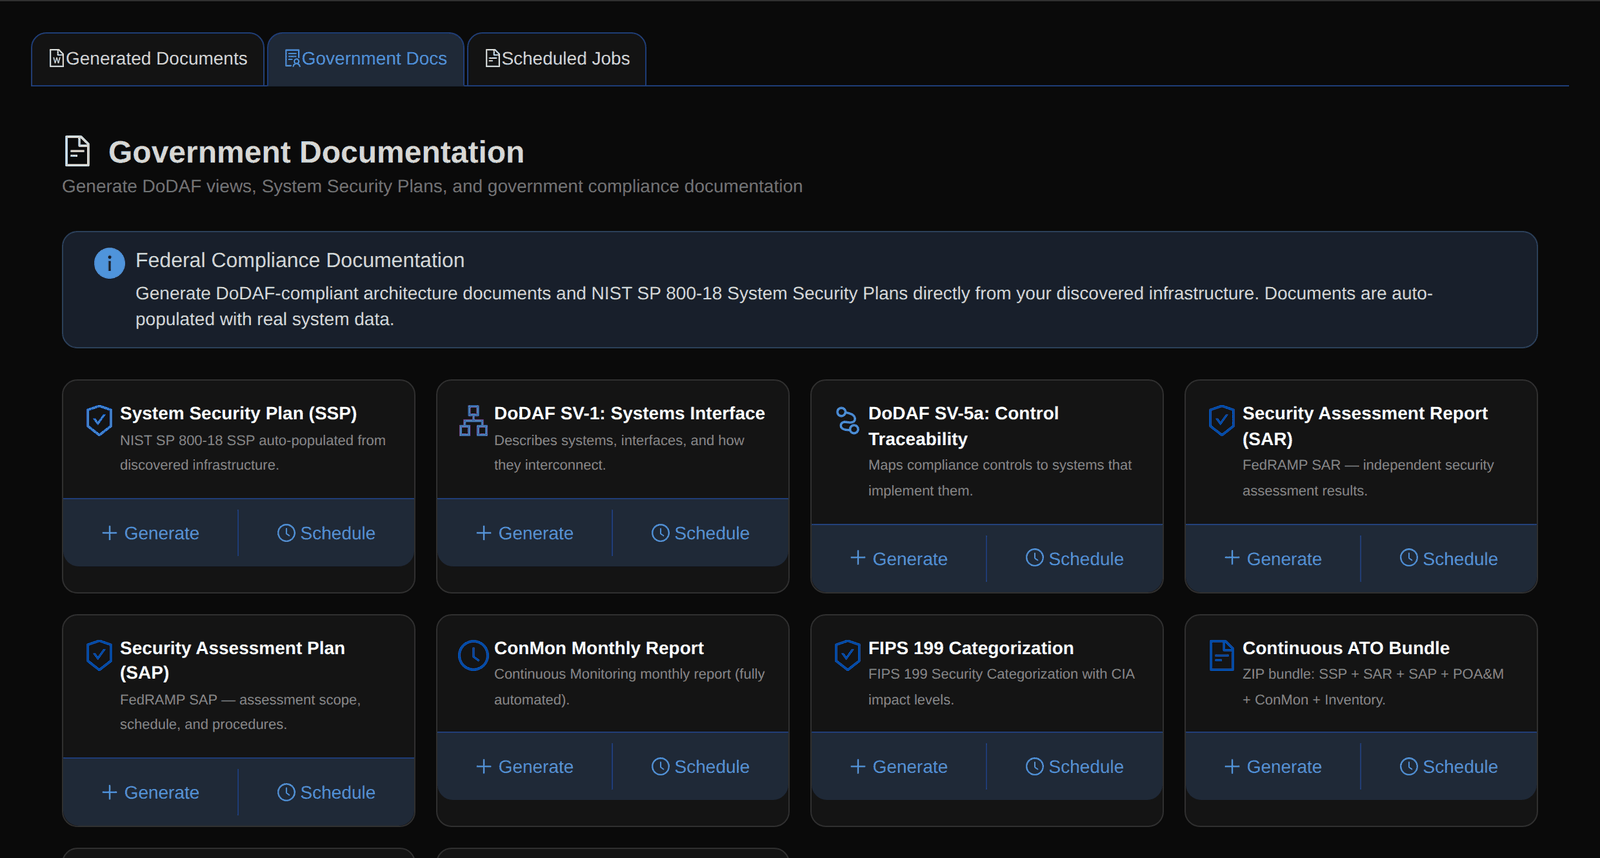
Documents are generated from the discovered infrastructure and its collected evidence, for example a System Security Plan, a security assessment report or a monthly monitoring report. A person reviews each draft before it is used in an assessment.
A catalogue of generated government documents, each with Generate and Schedule actions.
Try these screens yourself on the sample-data demo.
What you get
Four outcomes from the same graph.
Infrastructure visibility
Read-only discovery across cloud, SaaS, network, virtualization, containers and identity, merged into one inventory.
A resource rediscovered on every scan counts once.
Connector inventoryRisk prioritization
Attack paths that account for network egress, gateways and security groups, ranked by score and blast radius.
Start with the paths that reach sensitive data.
Lab walkthrough on sample dataAssessment evidence
Collected evidence mapped to framework controls, with draft documents for people to review and sign off.
Evidence stays with the asset and the control it supports.
Government solutionsEngineering deliverables
Diagrams, documentation and a Terraform export generated from discovered infrastructure.
The Terraform export is apply-grade for core AWS resources; other targets are best-effort.
Terraform export boundaryDownloads
Short summaries to share with your team or your contracting office.
See it on your own questions
Look at the sample-data demo, run a 14-day trial, or ask for a technical walkthrough with an engineer.